Veremos cómo crear una serie de rectángulos, detrás de las barras o líneas para resaltar periodos y, agilizar la comprensión de lo que estamos comunicando.
Versión 1: JSON template to import in Deneb
{
   "$schema":"https://vega.github.io/schema/vega-lite/v5.json",
   "usermeta":{
      "deneb":{
         "build":"1.1.0.0",
         "metaVersion":1,
         "provider":"vegaLite",
         "providerVersion":"5.2.0"
      },
      "interactivity":{
         "tooltip":true,
         "contextMenu":true,
         "selection":false,
         "dataPointLimit":50
      },
      "information":{
         "name":"Deneb #26 Highlighted Rectangles",
         "description":"[EN] Design using a rectangles behind bars. [ES] Diseño utilizando rectangulos detras de barras. Email: jrescalante@sentidoanalitica.com",
         "author":"Sentido Analítica - José Rafael Escalante",
         "uuid":"e5f78f35-7563-453d-b735-f265784a8749",
         "generated":"2022-02-08T18:42:16.360Z"
      },
      "dataset":[
         {
            "key":"__0__",
            "name":"Date",
            "description":"Fecha",
            "type":"dateTime",
            "kind":"column"
         },
         {
            "key":"__1__",
            "name":"Users",
            "description":"Valor Cuantitativo",
            "type":"numeric",
            "kind":"measure"
         }
      ]
   },
   "config":{
      "autosize":{
         "type":"fit",
         "contains":"padding"
      },
      "axis":{
         "domain":false,
         "ticks":false,
         "title":true,
         "grid":false,
         "labelAngle":0
      },
      "background":"#F6F6F6",
      "view":{
         "stroke":"transparent"
      }
   },
   "description":"Active Users with ranges - Usuarios activos con rangos",
   "data":{
      "name":"dataset"
   },
   "encoding":{
      "x":{
         "field":"__0__",
         "timeUnit":"month",
         "sort":[
            "Jan",
            "Feb"
         ],
         "scale":{
            "padding":0.4
         }
      },
      "y":{
         "aggregate":"sum",
         "type":"quantitative",
         "axis":{
            "labels":false
         }
      }
   },
   "layer":[
      {
         "description":"Rectangles - Rectangulos",
         "mark":"rect",
         "data":{
            "values":[
               {
                  "start":"Jan",
                  "end":"May",
                  "event":"1 Stripes"
               },
               {
                  "start":"Aug",
                  "end":"Nov",
                  "event":"2 Red"
               }
            ],
            "format":{
               "parse":{
                  "start":"date:'%b'",
                  "end":"date:'%b'"
               }
            }
         },
         "encoding":{
            "x":{
               "field":"start",
               "timeUnit":"month"
            },
            "x2":{
               "field":"end",
               "timeUnit":"month"
            },
            "color":{
               "field":"event",
               "scale":{
                  "range":[
                     "url(#diagonal-stripe-2-20)",
                     "#ED2939"
                  ]
               },
               "legend":null
            }
         }
      },
      {
         "description":"Users - Usuarios",
         "mark":{
            "type":"bar",
            "color":"#f6f6f6",
            "stroke":"#7f7f7f",
            "strokeWidth":1.5
         },
         "encoding":{
            "y":{
               "field":"__1__"
            }
         }
      },
      {
         "description":" Text integer - Texto entero",
         "mark":{
            "type":"text",
            "align":"center",
            "fill":"#272727",
            "yOffset":8,
            "size":10
         },
         "encoding":{
            "text":{
               "field":"__1__",
               "aggregate":"sum",
               "format":"0,0",
               "formatType":"pbiFormat"
            },
            "y":{
               "field":"__1__"
            }
         }
      }
   ]
}
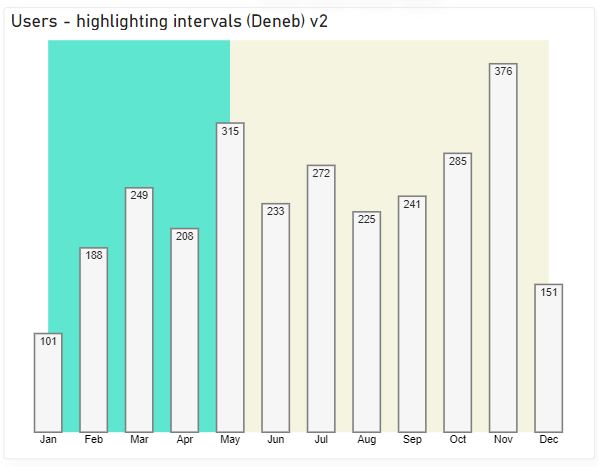
Versión 2: JSON template to import in Deneb
{
   "$schema":"https://vega.github.io/schema/vega-lite/v5.json",
   "usermeta":{
      "deneb":{
         "build":"1.1.0.0",
         "metaVersion":1,
         "provider":"vegaLite",
         "providerVersion":"5.2.0"
      },
      "interactivity":{
         "tooltip":true,
         "contextMenu":true,
         "selection":false,
         "dataPointLimit":50
      },
      "information":{
         "name":"Deneb #26 Highlighted Rectangles",
         "description":"[EN] Design using a rectangles behind bars. [ES] Diseño utilizando rectangulos detras de barras. Email: jrescalante@sentidoanalitica.com",
         "author":"Sentido Analítica - José Rafael Escalante",
         "uuid":"1f930f62-594d-4644-869e-e100def62edc",
         "generated":"2022-02-08T18:46:06.137Z"
      },
      "dataset":[
         {
            "key":"__0__",
            "name":"Date",
            "description":"Fecha",
            "type":"dateTime",
            "kind":"column"
         },
         {
            "key":"__1__",
            "name":"Users",
            "description":"Valor Cuantitativo",
            "type":"numeric",
            "kind":"measure"
         }
      ]
   },
   "config":{
      "autosize":{
         "type":"fit",
         "contains":"padding"
      },
      "axis":{
         "domain":false,
         "ticks":false,
         "title":true,
         "grid":false,
         "labelAngle":0
      },
      "view":{
         "stroke":"transparent"
      }
   },
   "description":"Active Users with ranges - Usuarios activos con rangos",
   "data":{
      "name":"dataset"
   },
   "encoding":{
      "x":{
         "field":"__0__",
         "timeUnit":"month",
         "sort":[
            "Jan",
            "Feb"
         ],
         "scale":{
            "padding":0.4
         }
      },
      "y":{
         "aggregate":"sum",
         "type":"quantitative",
         "axis":{
            "labels":false
         }
      }
   },
   "layer":[
      {
         "description":"Rectangles - Rectangulos",
         "mark":"rect",
         "data":{
            "values":[
               {
                  "start":"Jan",
                  "end":"May",
                  "event":"1 Magic Mint"
               },
               {
                  "start":"May",
                  "end":"Dec",
                  "event":"2 Eggshell"
               }
            ],
            "format":{
               "parse":{
                  "start":"date:'%b'",
                  "end":"date:'%b'"
               }
            }
         },
         "encoding":{
            "x":{
               "field":"start",
               "timeUnit":"month"
            },
            "x2":{
               "field":"end",
               "timeUnit":"month"
            },
            "color":{
               "field":"event",
               "scale":{
                  "range":[
                     "#5FE6D0",
                     "#F4F4E0"
                  ]
               },
               "legend":null
            }
         }
      },
      {
         "description":"Users - Usuarios",
         "mark":{
            "type":"bar",
            "color":"#f6f6f6",
            "stroke":"#7f7f7f",
            "strokeWidth":1.5
         },
         "encoding":{
            "y":{
               "field":"__1__"
            }
         }
      },
      {
         "description":" Text integer - Texto entero",
         "mark":{
            "type":"text",
            "align":"center",
            "fill":"#272727",
            "yOffset":8,
            "size":10
         },
         "encoding":{
            "text":{
               "field":"__1__",
               "aggregate":"sum",
               "format":"0,0",
               "formatType":"pbiFormat"
            },
            "y":{
               "field":"__1__"
            }
         }
      }
   ]
}
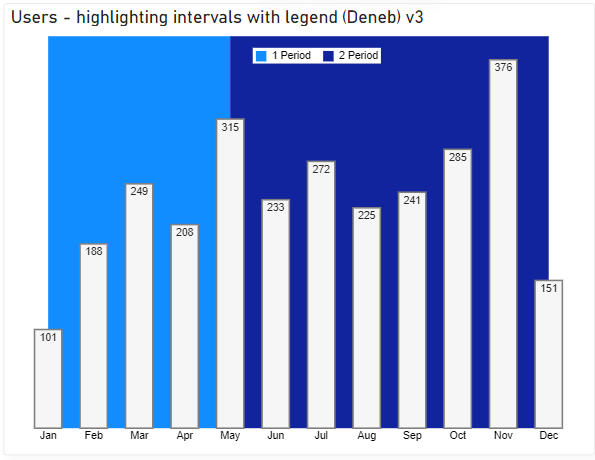
Versión 3: JSON template to import in Deneb
{
   "$schema":"https://vega.github.io/schema/vega-lite/v5.json",
   "usermeta":{
      "deneb":{
         "build":"1.1.0.0",
         "metaVersion":1,
         "provider":"vegaLite",
         "providerVersion":"5.2.0"
      },
      "interactivity":{
         "tooltip":true,
         "contextMenu":true,
         "selection":false,
         "dataPointLimit":50
      },
      "information":{
         "name":"Deneb #26 Highlighted Rectangles",
         "description":"[EN] Design using a rectangles behind bars. [ES] Diseño utilizando rectangulos detras de barras. Email: jrescalante@sentidoanalitica.com",
         "author":"Sentido Analítica - José Rafael Escalante",
         "uuid":"cc7fd230-1c76-4a31-b7d3-1e1113485a95",
         "generated":"2022-02-08T18:45:13.102Z"
      },
      "dataset":[
         {
            "key":"__0__",
            "name":"Date",
            "description":"Fecha",
            "type":"dateTime",
            "kind":"column"
         },
         {
            "key":"__1__",
            "name":"Users",
            "description":"Valor Cuantitativo",
            "type":"numeric",
            "kind":"measure"
         }
      ]
   },
   "config":{
      "autosize":{
         "type":"fit",
         "contains":"padding"
      },
      "axis":{
         "domain":false,
         "ticks":false,
         "title":true,
         "grid":false,
         "labelAngle":0
      },
      "view":{
         "stroke":"transparent"
      }
   },
   "description":"Active Users with ranges - Usuarios activos con rangos",
   "data":{
      "name":"dataset"
   },
   "encoding":{
      "x":{
         "field":"__0__",
         "timeUnit":"month",
         "sort":[
            "Jan",
            "Feb"
         ],
         "scale":{
            "padding":0.4
         }
      },
      "y":{
         "aggregate":"sum",
         "type":"quantitative",
         "axis":{
            "labels":false
         }
      }
   },
   "layer":[
      {
         "description":"Rectangles - Rectangulos",
         "mark":"rect",
         "data":{
            "values":[
               {
                  "start":"Jan",
                  "end":"May",
                  "event":"1 Period"
               },
               {
                  "start":"May",
                  "end":"Dec",
                  "event":"2 Period"
               }
            ],
            "format":{
               "parse":{
                  "start":"date:'%b'",
                  "end":"date:'%b'"
               }
            }
         },
         "encoding":{
            "x":{
               "field":"start",
               "timeUnit":"month"
            },
            "x2":{
               "field":"end",
               "timeUnit":"month"
            },
            "color":{
               "field":"event",
               "scale":{
                  "scheme":"pbiColorNominal"
               },
               "legend":{
                  "title":null,
                  "padding":2,
                  "direction":"horizontal",
                  "orient":"none",
                  "legendY":11,
                  "legendX":225,
                  "fillColor":"white"
               }
            }
         }
      },
      {
         "description":"Users - Usuarios",
         "mark":{
            "type":"bar",
            "color":"#f6f6f6",
            "stroke":"#7f7f7f",
            "strokeWidth":1.5
         },
         "encoding":{
            "y":{
               "field":"__1__"
            }
         }
      },
      {
         "description":" Text integer - Texto entero",
         "mark":{
            "type":"text",
            "align":"center",
            "fill":"#272727",
            "yOffset":8,
            "size":10
         },
         "encoding":{
            "text":{
               "field":"__1__",
               "aggregate":"sum",
               "format":"0,0",
               "formatType":"pbiFormat"
            },
            "y":{
               "field":"__1__"
            }
         }
      }
   ]
}
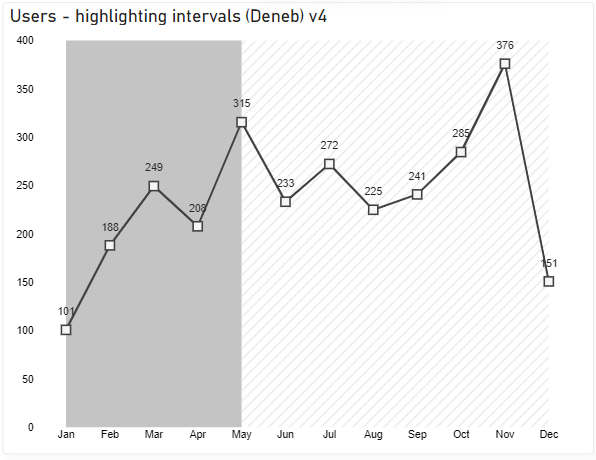
Versión 4: JSON template to import in Deneb
{
   "$schema":"https://vega.github.io/schema/vega-lite/v5.json",
   "usermeta":{
      "deneb":{
         "build":"1.1.0.0",
         "metaVersion":1,
         "provider":"vegaLite",
         "providerVersion":"5.2.0"
      },
      "interactivity":{
         "tooltip":true,
         "contextMenu":true,
         "selection":false,
         "dataPointLimit":50
      },
      "information":{
         "name":"Deneb #26 Highlighted Rectangles",
         "description":"[EN] Design using a rectangles behind lines. [ES] Diseño utilizando rectangulos detras de lineas. Email: jrescalante@sentidoanalitica.com",
         "author":"Sentido Analítica - José Rafael Escalante",
         "uuid":"fd5eede9-07ed-4572-9055-6531e92710bc",
         "generated":"2022-02-09T20:03:33.943Z"
      },
      "dataset":[
         {
            "key":"__0__",
            "name":"Date",
            "description":"Fecha",
            "type":"dateTime",
            "kind":"column"
         },
         {
            "key":"__1__",
            "name":"Users",
            "description":"Valor Cuantitativo",
            "type":"numeric",
            "kind":"measure"
         }
      ]
   },
   "config":{
      "autosize":{
         "type":"fit",
         "contains":"padding"
      },
      "axis":{
         "domain":false,
         "ticks":false,
         "title":true,
         "grid":false,
         "labelAngle":0
      },
      "view":{
         "stroke":"transparent"
      }
   },
   "description":"Active Users with ranges - Usuarios activos con rangos",
   "data":{
      "name":"dataset"
   },
   "encoding":{
      "x":{
         "field":"__0__",
         "timeUnit":"month",
         "sort":[
            "Jan",
            "Feb"
         ],
         "scale":{
            "padding":0.4
         }
      },
      "y":{
         "aggregate":"sum",
         "type":"quantitative"
      }
   },
   "layer":[
      {
         "description":"Rectangles - Rectangulos",
         "mark":"rect",
         "data":{
            "values":[
               {
                  "start":"Jan",
                  "end":"May",
                  "event":"1 Grey"
               },
               {
                  "start":"May",
                  "end":"Dec",
                  "event":"2 Stripes"
               }
            ],
            "format":{
               "parse":{
                  "start":"date:'%b'",
                  "end":"date:'%b'"
               }
            }
         },
         "encoding":{
            "x":{
               "field":"start",
               "timeUnit":"month"
            },
            "x2":{
               "field":"end",
               "timeUnit":"month"
            },
            "color":{
               "field":"event",
               "scale":{
                  "range":[
                     "#c4c4c4",
                     "url(#diagonal-stripe-1-10)"
                  ]
               },
               "legend":null
            }
         }
      },
      {
         "description":"Users - Usuarios",
         "mark":{
            "type":"line",
            "stroke":"#404040",
            "strokeWidth":2
         },
         "encoding":{
            "y":{
               "field":"__1__"
            }
         }
      },
      {
         "description":"Users - Usuarios",
         "mark":{
            "type":"square",
            "size":75,
            "color":"#f6f6f6",
            "stroke":"#404040",
            "strokeWidth":1.5
         },
         "encoding":{
            "y":{
               "field":"__1__"
            }
         }
      },
      {
         "description":" Text integer - Texto entero",
         "mark":{
            "type":"text",
            "align":"center",
            "fill":"#272727",
            "yOffset":-17,
            "size":10
         },
         "encoding":{
            "text":{
               "field":"__1__",
               "aggregate":"sum",
               "format":"0,0",
               "formatType":"pbiFormat"
            },
            "y":{
               "field":"__1__"
            }
         }
      }
   ]
}