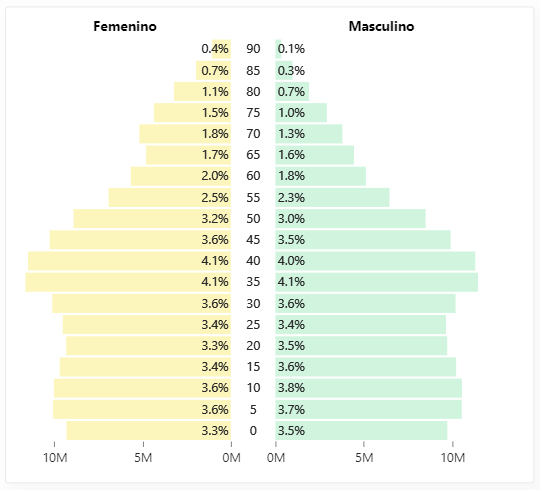
Un gráfico muy utilizado al momento de analizar la distribución de la población.
Descarga la tabla utilizada aquí.
JSON template to import in Deneb
{
  "$schema": "https://vega.github.io/schema/vega-lite/v5.json",
  "usermeta": {
    "deneb": {
      "build": "1.2.0.1",
      "metaVersion": 1,
      "provider": "vegaLite",
      "providerVersion": "5.2.0"
    },
    "interactivity": {
      "tooltip": true,
      "contextMenu": true,
      "selection": false,
      "highlight": false,
      "dataPointLimit": 50
    },
    "information": {
      "name": "Deneb #28 Piramide Poblacional",
      "description": "Piramide poblacional. Email: jrescalante@sentidoanalitica.com",
      "author": "Sentido Analítica - José Rafael Escalante",
      "uuid": "53cc8757-5712-4250-ab01-cde642ed68b3",
      "generated": "2022-05-31T13:30:56.954Z"
    },
    "dataset": [
      {
        "key": "__0__",
        "name": "age",
        "description": "Edad",
        "type": "numeric",
        "kind": "column"
      },
      {
        "key": "__1__",
        "name": "sex",
        "description": "Sexo o Genero",
        "type": "numeric",
        "kind": "column"
      },
      {
        "key": "__2__",
        "name": "people",
        "description": "Cantidad de personas u observacion",
        "type": "numeric",
        "kind": "measure"
      },
      {
        "key": "__3__",
        "name": "Porcentaje Femenino",
        "description": "",
        "type": "numeric",
        "kind": "measure"
      },
      {
        "key": "__4__",
        "name": "Porcentaje Masculino",
        "description": "",
        "type": "numeric",
        "kind": "measure"
      },
      {
        "key": "__5__",
        "name": "Femenino 1990",
        "description": "Medida de periodo anterior",
        "type": "numeric",
        "kind": "measure"
      },
      {
        "key": "__6__",
        "name": "Femenino 1980",
        "description": "Medida de periodo anterior",
        "type": "numeric",
        "kind": "measure"
      },
      {
        "key": "__7__",
        "name": "Masculino 1980",
        "description": "Medida de periodo anterior",
        "type": "numeric",
        "kind": "measure"
      },
      {
        "key": "__8__",
        "name": "Masculino 1990",
        "description": "Medida de periodo anterior",
        "type": "numeric",
        "kind": "measure"
      }
    ]
  },
  "config": {
    "autosize": {
      "type": "fit",
      "contains": "padding"
    },
    "view": {"stroke": "transparent"},
    "font": "Segoe UI",
    "arc": {},
    "area": {
      "line": true,
      "opacity": 0.6
    },
    "bar": {},
    "line": {
      "strokeWidth": 3,
      "strokeCap": "round",
      "strokeJoin": "round"
    },
    "path": {},
    "point": {
      "filled": true,
      "size": 75
    },
    "rect": {},
    "shape": {},
    "symbol": {
      "strokeWidth": 1.5,
      "size": 50
    },
    "text": {
      "font": "Segoe UI",
      "fontSize": 12,
      "fill": "#272727"
    },
    "axis": {
      "ticks": true,
      "grid": false,
      "domain": false,
      "labelColor": "#272727",
      "labelFontSize": 12,
      "titleFont": "wf_standard-font, helvetica, arial, sans-serif",
      "titleColor": "#252423",
      "titleFontSize": 16,
      "titleFontWeight": "normal"
    },
    "axisQuantitative": {
      "tickCount": 3,
      "grid": false,
      "gridColor": "#C8C6C4",
      "gridDash": [1, 5],
      "labelFlush": false
    },
    "axisBand": {"tickExtra": true},
    "axisX": {"labelPadding": 5},
    "axisY": {"labelPadding": 10},
    "header": {
      "titleFont": "wf_standard-font, helvetica, arial, sans-serif",
      "titleFontSize": 16,
      "titleColor": "#252423",
      "labelFont": "Segoe UI",
      "labelFontSize": 13.333333333333332,
      "labelColor": "#605E5C"
    },
    "legend": {
      "titleFont": "Segoe UI",
      "titleFontWeight": "bold",
      "titleColor": "#605E5C",
      "labelFont": "Segoe UI",
      "labelFontSize": 13.333333333333332,
      "labelColor": "#605E5C",
      "symbolType": "circle",
      "symbolSize": 75
    }
  },
  "data": {"name": "dataset"},
  "transform": [
    {
      "calculate": "datum['__1__'] == 2 ? 'Femenino' : 'Masculino'",
      "as": "genero"
    }
  ],
  "spacing": 0,
  "hconcat": [
    {
      "layer": [
        {
          "transform": [
            {
              "filter": {
                "field": "genero",
                "equal": "Femenino"
              }
            }
          ],
          "title": "Femenino",
          "mark": "bar",
          "encoding": {
            "y": {
              "field": "__0__",
              "axis": null,
              "sort": "descending"
            },
            "x": {
              "aggregate": "sum",
              "field": "__2__",
              "title": "",
              "axis": {"format": "s"},
              "sort": "descending"
            },
            "color": {
              "field": "genero",
              "scale": {
                "range": [
                  "#fee9e1",
                  "#ccdbfd"
                ]
              }
            }
          }
        },
        {
          "transform": [
            {
              "filter": {
                "field": "genero",
                "equal": "Femenino"
              }
            }
          ],
          "mark": {
            "type": "line",
            "color": "#fd2600",
            "strokeWidth": 1
          },
          "encoding": {
            "y": {
              "field": "__0__",
              "axis": null,
              "sort": "descending"
            },
            "x": {
              "aggregate": "sum",
              "field": "__5__",
              "sort": "descending"
            }
          }
        },
        {
          "transform": [
            {
              "filter": {
                "field": "genero",
                "equal": "Femenino"
              }
            }
          ],
          "mark": {
            "type": "line",
            "color": "#272727",
            "strokeWidth": 1
          },
          "encoding": {
            "y": {
              "field": "__0__",
              "axis": null,
              "sort": "descending"
            },
            "x": {
              "aggregate": "sum",
              "field": "__6__",
              "sort": "descending"
            }
          }
        },
        {
          "mark": {
            "type": "text",
            "xOffset": 85
          },
          "encoding": {
            "y": {
              "field": "__0__",
              "axis": null,
              "sort": "descending"
            },
            "text": {
              "field": "__3__",
              "format": ",0.0%",
              "formatType": "pbiFormat"
            }
          }
        }
      ]
    },
    {
      "mark": {
        "type": "text",
        "align": "center"
      },
      "encoding": {
        "y": {
          "field": "__0__",
          "axis": null,
          "sort": "descending"
        },
        "text": {"field": "__0__"}
      }
    },
    {
      "layer": [
        {
          "transform": [
            {
              "filter": {
                "field": "genero",
                "equal": "Masculino"
              }
            }
          ],
          "title": "Masculino",
          "mark": "bar",
          "encoding": {
            "y": {
              "field": "__0__",
              "axis": null,
              "sort": "descending"
            },
            "x": {
              "aggregate": "sum",
              "field": "__2__",
              "title": "",
              "axis": {"format": "s"}
            },
            "color": {
              "field": "genero",
              "legend": null
            }
          }
        },
        {
          "transform": [
            {
              "filter": {
                "field": "genero",
                "equal": "Masculino"
              }
            }
          ],
          "title": "Masculino",
          "mark": {
            "type": "line",
            "color": "#fd2600",
            "strokeWidth": 1
          },
          "encoding": {
            "y": {
              "field": "__0__",
              "axis": null,
              "sort": "descending"
            },
            "x": {
              "aggregate": "sum",
              "field": "__8__",
              "title": "",
              "axis": {"format": "s"}
            }
          }
        },
        {
          "transform": [
            {
              "filter": {
                "field": "genero",
                "equal": "Masculino"
              }
            }
          ],
          "title": "Masculino",
          "mark": {
            "type": "line",
            "color": "#272727",
            "strokeWidth": 1
          },
          "encoding": {
            "y": {
              "field": "__0__",
              "axis": null,
              "sort": "descending"
            },
            "x": {
              "aggregate": "sum",
              "field": "__7__",
              "title": "",
              "axis": {"format": "s"}
            }
          }
        },
        {
          "mark": {
            "type": "text",
            "xOffset": -85
          },
          "encoding": {
            "y": {
              "field": "__0__",
              "axis": null,
              "sort": "descending"
            },
            "text": {
              "field": "__4__",
              "format": ",0.0%",
              "formatType": "pbiFormat"
            }
          }
        }
      ]
    }
  ]
}
Versión 2: JSON template to import in Deneb
{
  "$schema": "https://vega.github.io/schema/vega-lite/v5.json",
  "usermeta": {
    "deneb": {
      "build": "1.2.0.1",
      "metaVersion": 1,
      "provider": "vegaLite",
      "providerVersion": "5.2.0"
    },
    "interactivity": {
      "tooltip": true,
      "contextMenu": true,
      "selection": false,
      "highlight": false,
      "dataPointLimit": 50
    },
    "information": {
      "name": "Deneb #28 Piramide Poblacional",
      "description": "Piramide poblacional. Email: jrescalante@sentidoanalitica.com",
      "author": "Sentido Analítica - José Rafael Escalante",
      "uuid": "aa991e9d-80bd-4073-b8ec-4980a42c7ac5",
      "generated": "2022-06-02T16:33:32.563Z"
    },
    "dataset": [
      {
        "key": "__0__",
        "name": "age",
        "description": "Edad",
        "type": "numeric",
        "kind": "column"
      },
      {
        "key": "__1__",
        "name": "sex",
        "description": "Sexo o Genero",
        "type": "numeric",
        "kind": "column"
      },
      {
        "key": "__2__",
        "name": "people",
        "description": "Cantidad de personas u observacion",
        "type": "numeric",
        "kind": "measure"
      },
      {
        "key": "__3__",
        "name": "Porcentaje Femenino",
        "description": "",
        "type": "numeric",
        "kind": "measure"
      },
      {
        "key": "__4__",
        "name": "Porcentaje Masculino",
        "description": "",
        "type": "numeric",
        "kind": "measure"
      }
    ]
  },
  "config": {
    "autosize": {
      "type": "fit",
      "contains": "padding"
    },
    "view": {"stroke": "transparent"},
    "font": "Segoe UI",
    "arc": {},
    "area": {
      "line": true,
      "opacity": 0.6
    },
    "bar": {},
    "line": {
      "strokeWidth": 3,
      "strokeCap": "round",
      "strokeJoin": "round"
    },
    "path": {},
    "point": {
      "filled": true,
      "size": 75
    },
    "rect": {},
    "shape": {},
    "symbol": {
      "strokeWidth": 1.5,
      "size": 50
    },
    "text": {
      "font": "Segoe UI",
      "fontSize": 12,
      "fill": "#272727"
    },
    "axis": {
      "ticks": true,
      "grid": false,
      "domain": false,
      "labelColor": "#272727",
      "labelFontSize": 12,
      "titleFont": "wf_standard-font, helvetica, arial, sans-serif",
      "titleColor": "#252423",
      "titleFontSize": 16,
      "titleFontWeight": "normal"
    },
    "axisQuantitative": {
      "tickCount": 3,
      "grid": false,
      "gridColor": "#C8C6C4",
      "gridDash": [1, 5],
      "labelFlush": false
    },
    "axisBand": {"tickExtra": true},
    "axisX": {"labelPadding": 5},
    "axisY": {"labelPadding": 10},
    "header": {
      "titleFont": "wf_standard-font, helvetica, arial, sans-serif",
      "titleFontSize": 16,
      "titleColor": "#252423",
      "labelFont": "Segoe UI",
      "labelFontSize": 13.333333333333332,
      "labelColor": "#605E5C"
    },
    "legend": {
      "titleFont": "Segoe UI",
      "titleFontWeight": "bold",
      "titleColor": "#605E5C",
      "labelFont": "Segoe UI",
      "labelFontSize": 13.333333333333332,
      "labelColor": "#605E5C",
      "symbolType": "circle",
      "symbolSize": 75
    }
  },
  "data": {"name": "dataset"},
  "transform": [
    {
      "calculate": "datum['__1__'] == 2 ? 'Femenino' : 'Masculino'",
      "as": "genero"
    }
  ],
  "spacing": 0,
  "hconcat": [
    {
      "layer": [
        {
          "transform": [
            {
              "filter": {
                "field": "genero",
                "equal": "Femenino"
              }
            }
          ],
          "title": "Femenino",
          "mark": "bar",
          "encoding": {
            "y": {
              "field": "__0__",
              "axis": null,
              "sort": "descending"
            },
            "x": {
              "aggregate": "sum",
              "field": "__2__",
              "title": "",
              "axis": {"format": "s"},
              "sort": "descending"
            },
            "color": {
              "field": "genero",
              "scale": {
                "range": [
                  "#fcf6bd",
                  "#d0f4de"
                ]
              }
            }
          }
        },
        {
          "mark": {
            "type": "text",
            "xOffset": 85
          },
          "encoding": {
            "y": {
              "field": "__0__",
              "axis": null,
              "sort": "descending"
            },
            "text": {
              "field": "__3__",
              "format": ",0.0%",
              "formatType": "pbiFormat"
            }
          }
        }
      ]
    },
    {
      "mark": {
        "type": "text",
        "align": "center"
      },
      "encoding": {
        "y": {
          "field": "__0__",
          "axis": null,
          "sort": "descending"
        },
        "text": {"field": "__0__"}
      }
    },
    {
      "layer": [
        {
          "transform": [
            {
              "filter": {
                "field": "genero",
                "equal": "Masculino"
              }
            }
          ],
          "title": "Masculino",
          "mark": "bar",
          "encoding": {
            "y": {
              "field": "__0__",
              "axis": null,
              "sort": "descending"
            },
            "x": {
              "aggregate": "sum",
              "field": "__2__",
              "title": "",
              "axis": {"format": "s"}
            },
            "color": {
              "field": "genero",
              "legend": null
            }
          }
        },
        {
          "mark": {
            "type": "text",
            "xOffset": -85
          },
          "encoding": {
            "y": {
              "field": "__0__",
              "axis": null,
              "sort": "descending"
            },
            "text": {
              "field": "__4__",
              "format": ",0.0%",
              "formatType": "pbiFormat"
            }
          }
        }
      ]
    }
  ]
}
¿400 líneas o 250 líneas de Deneb? 🤯🙏…. wuao! 🤓🤘
Al crear la plantilla de la pirámide con las comparaciones se generan 400 líneas; pero al importarla se crean en Deneb, 246 líneas en las especificaciones y 71 líneas en el config. En cambio, en la versión corta, la plantilla genera 268 líneas; pero en Deneb, 134 en las especificaciones y 71 líneas en el config.
Hola Jose, primero agradecerte por estos tutoriales de deneb que me han servido mucho, estoy creando un grafico de lineas para ver las tendencias de unos productos en el tiempo, las lineas son de diferentes productos pero hay unos especificos que necesitan un color exacto, ejemplo el producto A debe ser color azul, el producto B color rojo, y el resto de productos C,D,E,F,etc pueden ser de cualquier otro color, cree una condicion en color para el producto A y B y ya solucione esto, pero el problema es que en la legenda no me refleja los mismos colores, es decir en la linea de grafico del producto A es azul, pero en la legenda el producto A es gris, igual con el producto B, tu podrias decirme como configurar la legenda para que tome los mismos colores, he consultado, pero no encuentro documentacion de este tema, muchas gracias!
Hola Fredy, sugiero leer la documentación relacionada a las leyendas aquí: https://vega.github.io/vega-lite/docs/legend.html
Top José ! Thanks to you I can brush up my Deneb and my spanish language 😉 2 in 1 !
Glad to hear you Vincent!